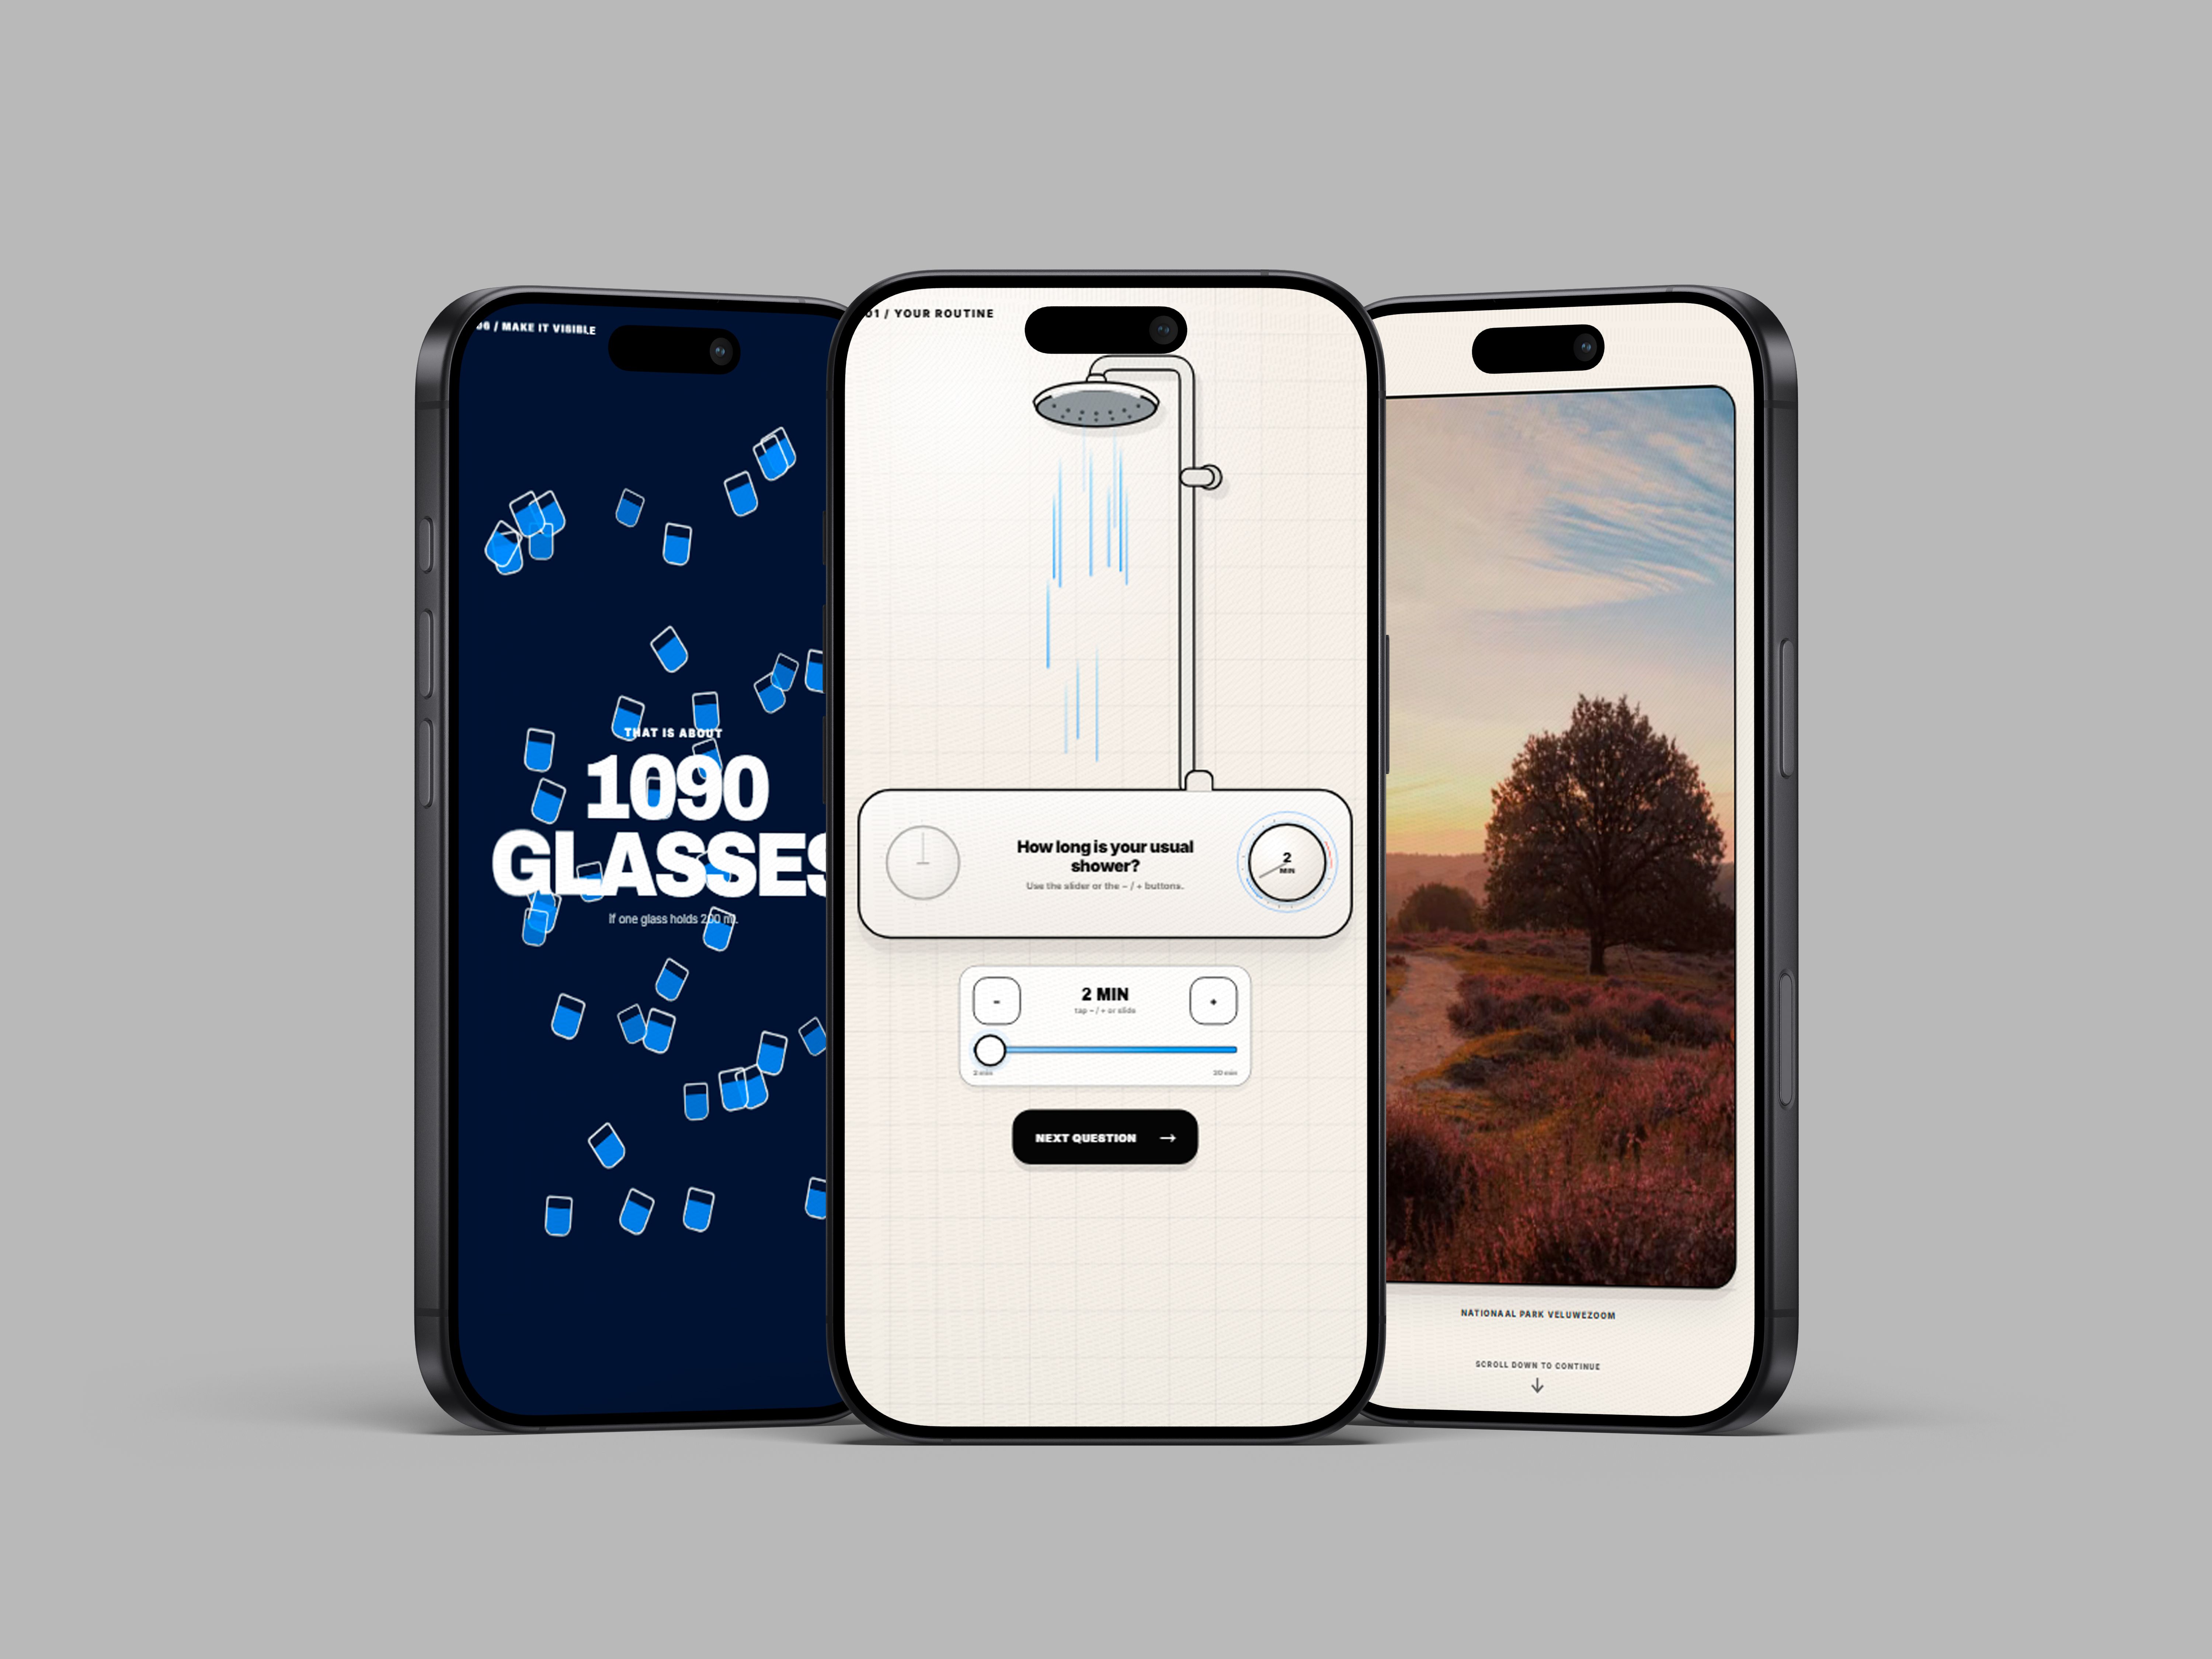
A mobile-first interactive story that helps young adults understand how much water they use at home, built around routines they already know: showering, doing the dishes and laundry.
The challenge
Water consumption is part of everyday life, but understanding how much we actually use can be difficult. A number in liters doesn’t always communicate what that consumption looks like in practice.
I interviewed young adults about their water use, and it confirmed that their awareness of their actual consumption was limited. The interviews also showed what made the topic click: what it costs, comparisons with their own habits, and explanations you can see rather than read.
Five concepts, one direction
I explored five storytelling concepts before choosing one to develop. The direction I chose was a mobile-first, interactive experience that starts from everyday activities instead of statistics, so the numbers are always tied to something the user recognises from their own day.
Designing the interaction
The experience asks short questions about your habits, such as how long you usually shower. Each question has one clear input, a slider with − and + buttons, and a single button to move on to the next question.
Your answers then come back as visual comparisons and personal feedback. Liters turn into something you can picture, like the number of 200 ml glasses your routine adds up to.
Testing and iteration
The design went through several iterations, each informed by usability testing, feedback from experts and technical testing across devices, so the interactions would hold up on different phones and screen sizes.
Outcome and reflection
The result is a finished interactive experience that turns personal habits into comparisons people can relate to.
The project taught me that data only becomes meaningful when it connects to something personal. It’s designed to build awareness; I didn’t measure whether it changes behavior, and that would be the obvious next question to test.