A lead and quotation dashboard that gives small service businesses one clear place to track incoming requests, prepare quotes and see who needs a follow-up.
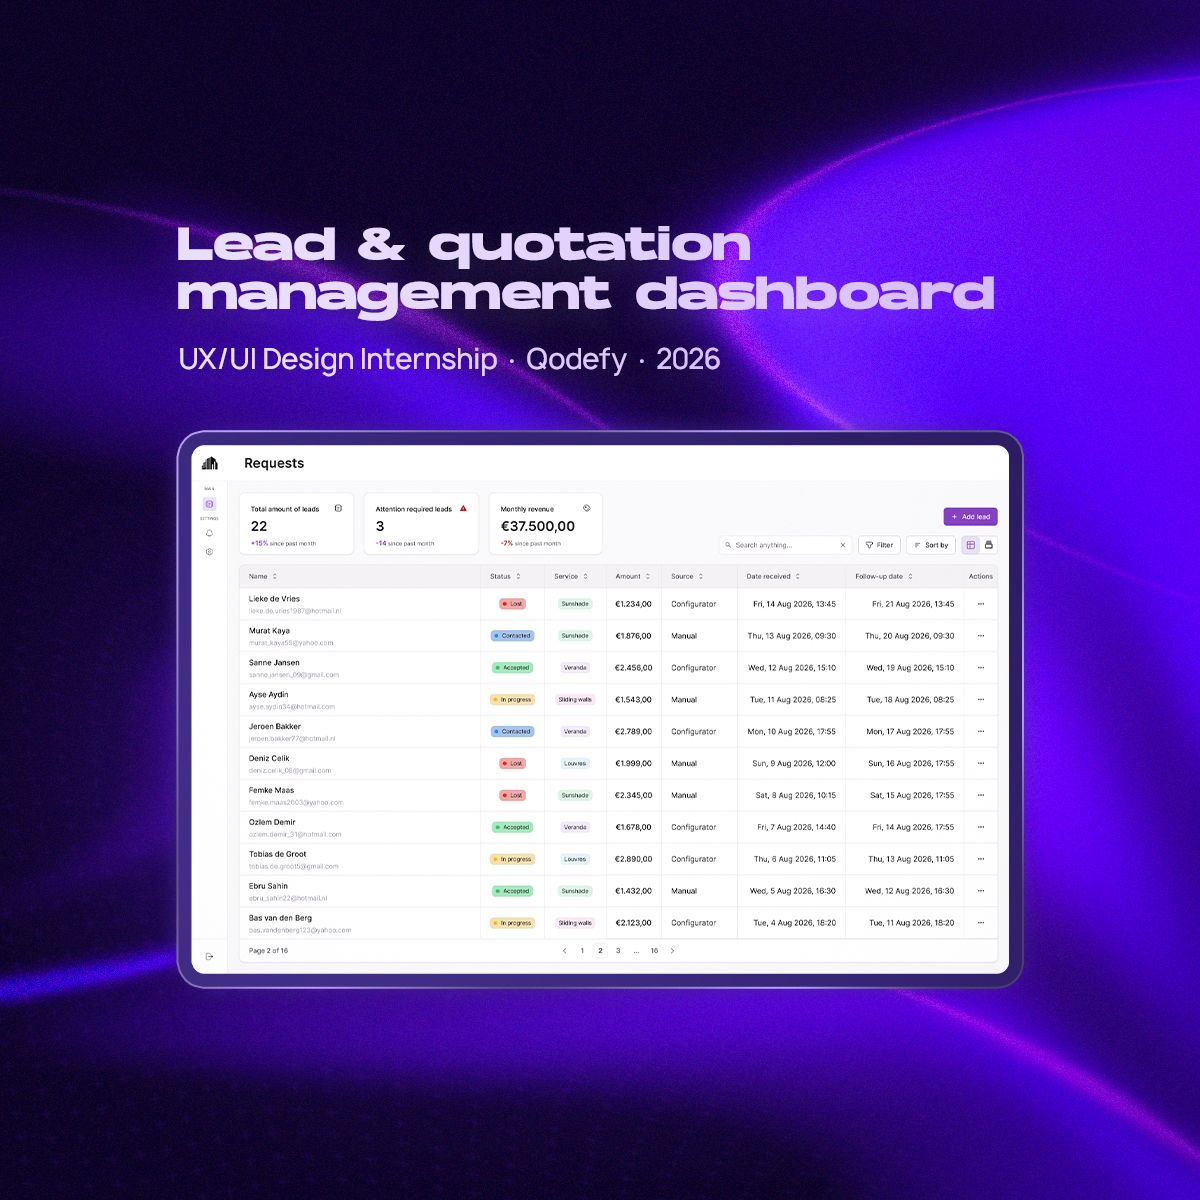
The challenge
Small service businesses receive customer requests through many channels: WhatsApp, phone calls, their website, product configurators and referrals. That information rarely ends up in one place.
In the businesses I spoke to, leads were tracked across WhatsApp conversations, paper notes, spreadsheets and memory. Quotations were often calculated by hand, and whether a customer got a follow-up depended largely on the owner remembering to get back to them.
The question I worked from: how can managing leads and quotations be simple enough for daily use, while still giving a business the overview it needs so no opportunity gets forgotten?
Understanding the workflow
Before designing anything, I interviewed people working in service businesses about how they handle new customer requests today.
Instead of asking which features they wanted, I followed how a lead moves from first contact to an accepted or rejected quotation. That showed where information gets lost and where time goes. The same problems kept coming back:
- 01
Too many channels
Leads arrive through WhatsApp, phone calls, websites, configurators and referrals.
- 02
Scattered information
Customer details are stored in different places.
- 03
Manual quotations
Quotations often require calculations by hand.
- 04
No clear priorities
It’s difficult to see which leads still need attention.
- 05
Forgotten follow-ups
Following up depends on someone remembering to do it.
- 06
Tools that feel too heavy
Existing systems can feel too complicated for a smaller business.
This changed the direction of the project. The dashboard didn’t need to become a large CRM. It needed to make the core workflow fast, clear and easy to keep up to date.
Choosing the right overview
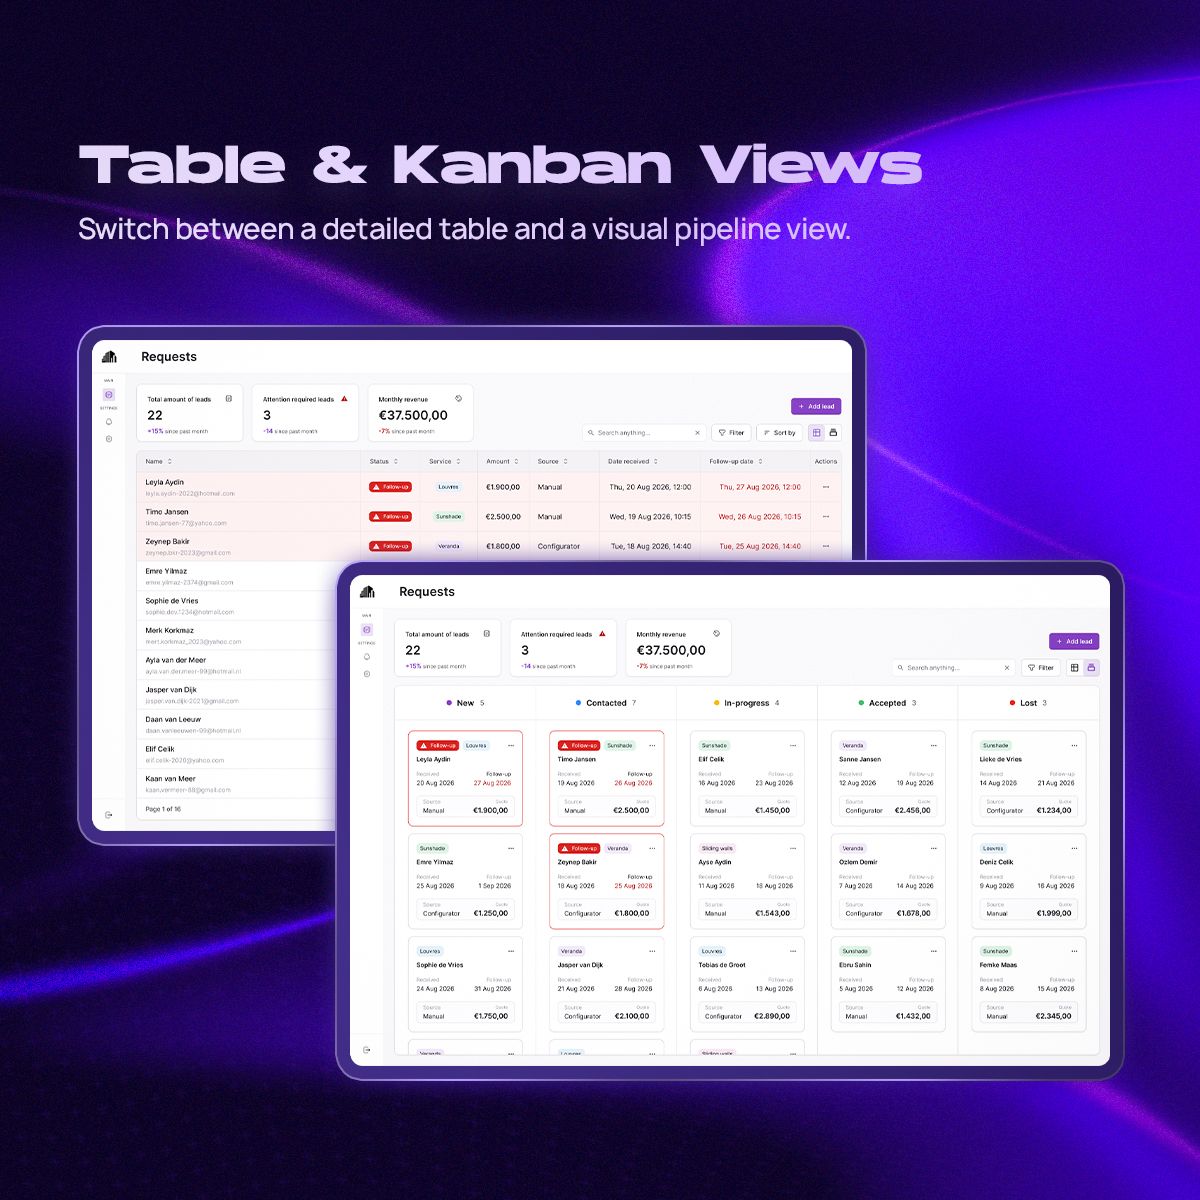
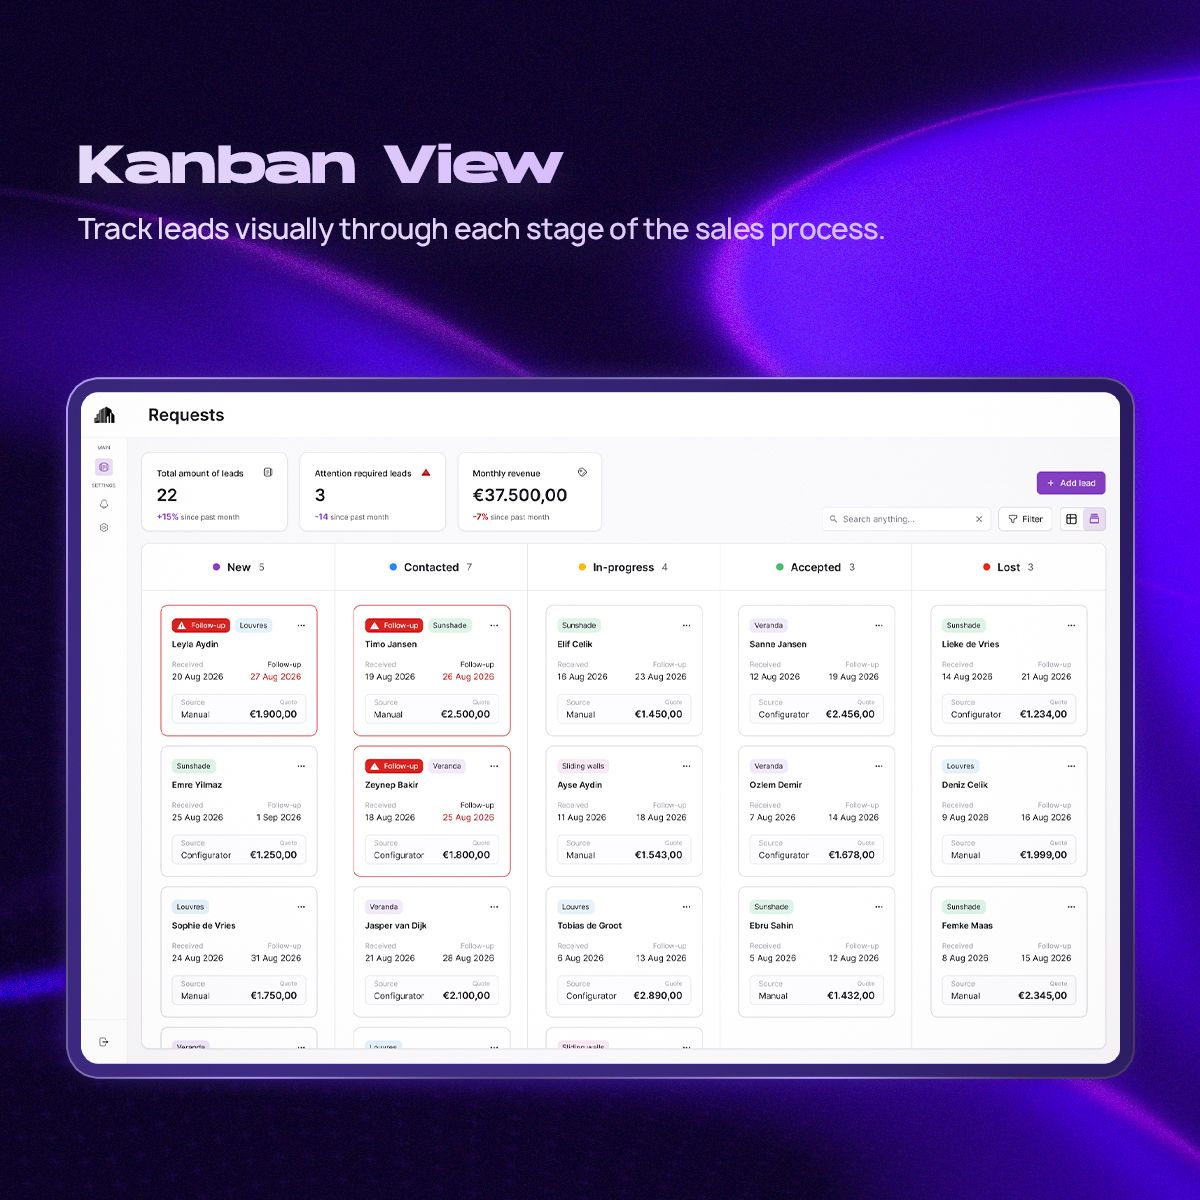
The most important early decision was how to present leads. A Kanban board shows where each lead is in the sales process. A table is much better when you need to compare customer details, dates, quotation values and follow-ups.
Rather than choosing one, I designed the dashboard around a hybrid, pipeline-first approach: the same leads, shown as a structured table or a visual Kanban board, depending on what someone is trying to do. This became the foundation of the product.
Testing what people notice
I built the structure as a mid-fidelity prototype and ran think-aloud tests to see whether people understood the dashboard without extra explanation.
One finding stood out: leads that needed a follow-up weren’t noticeable enough. In the first version that was communicated mainly through a small warning icon. People could technically see it, but it was easy to overlook while scanning the table.
In the final design, overdue and attention-required leads are far more prominent, through clearer status indicators, highlighted information and a stronger hierarchy.
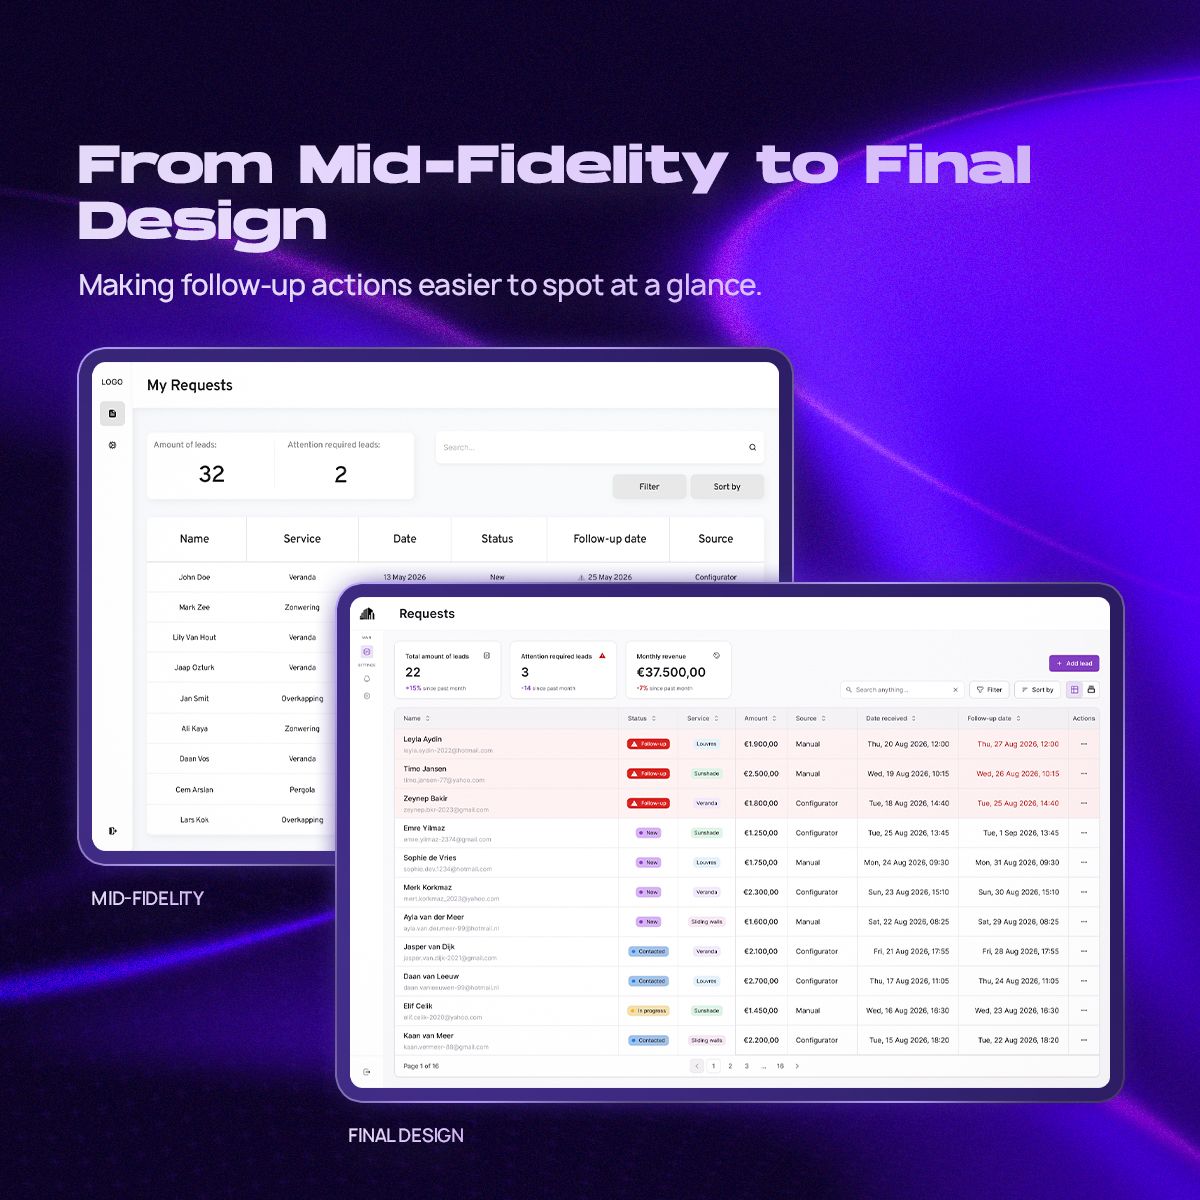
Information being present doesn’t automatically mean it’s noticeable.
The final experience
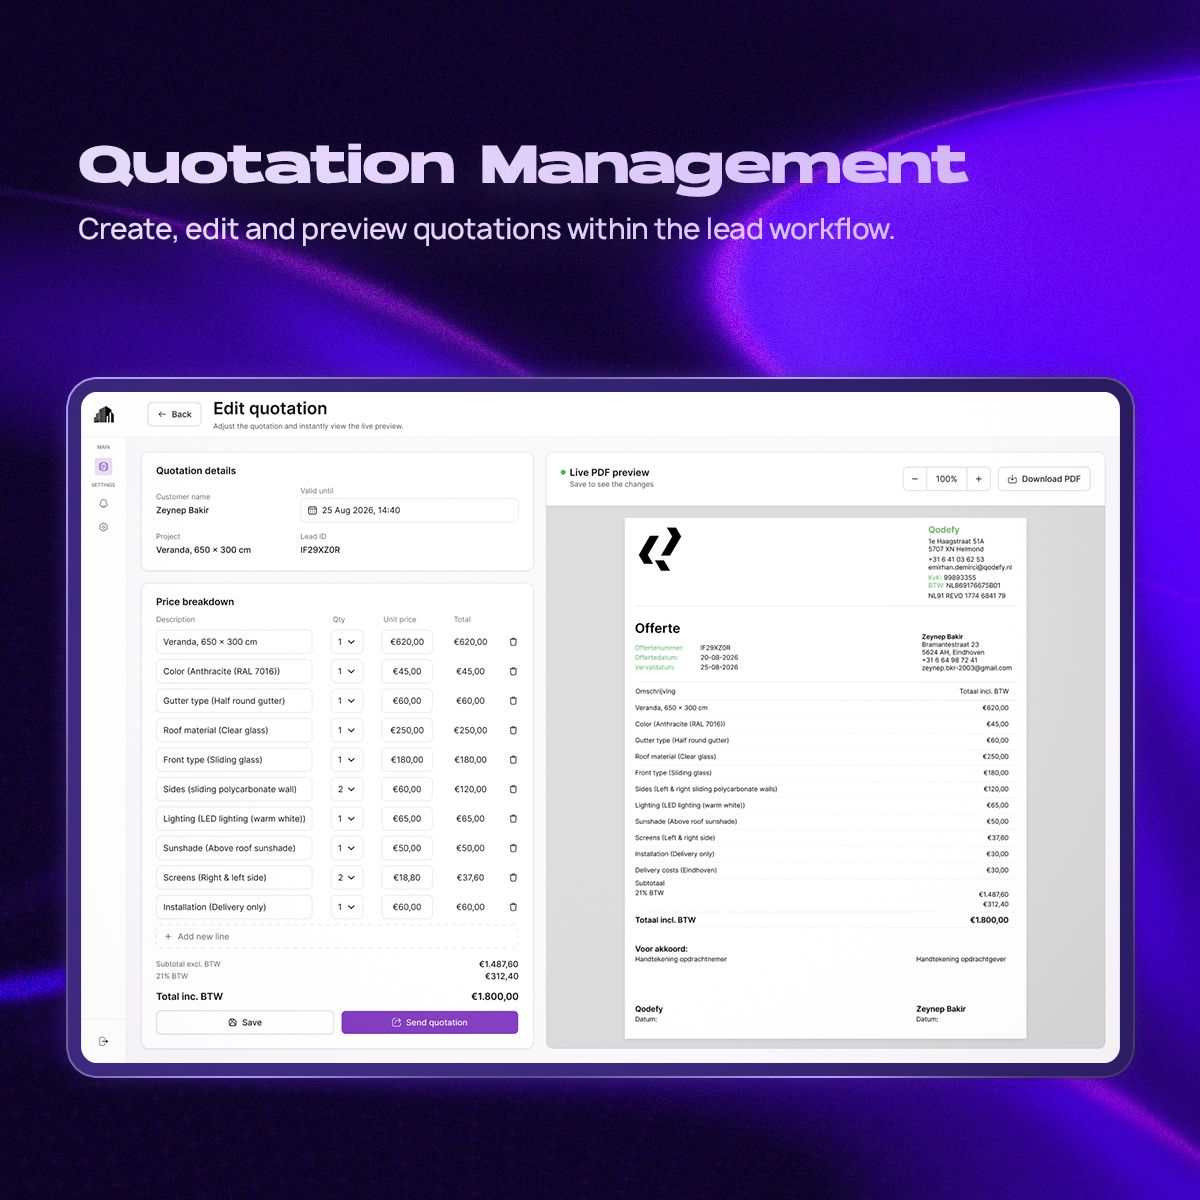
The final concept brings a fragmented workflow into one place: an overview of every lead, the details behind each one, and the quotation that belongs to it.
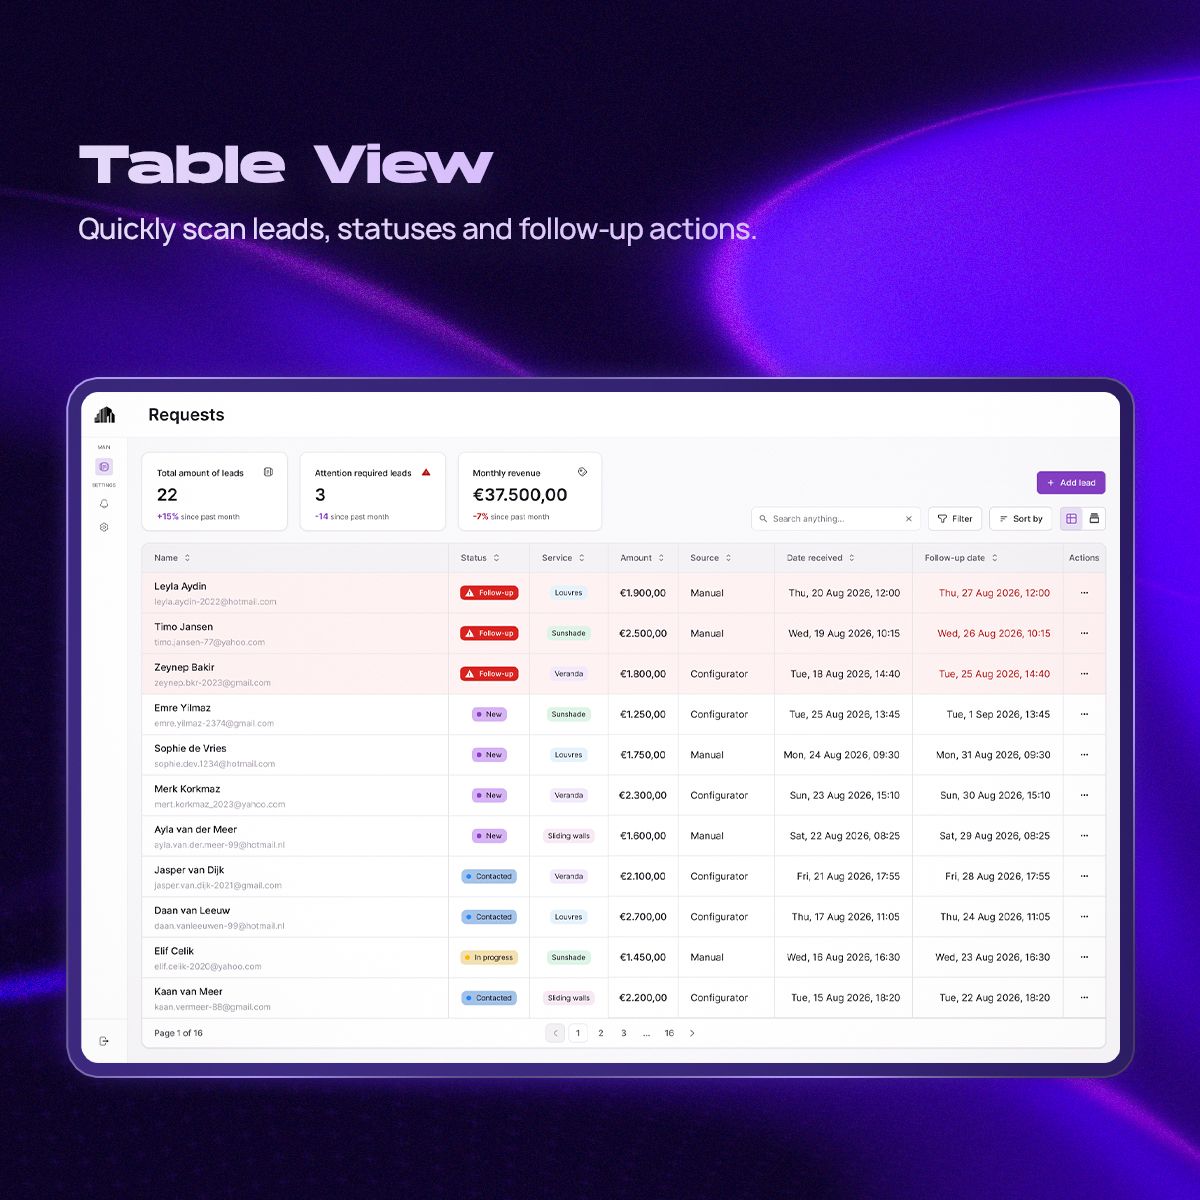
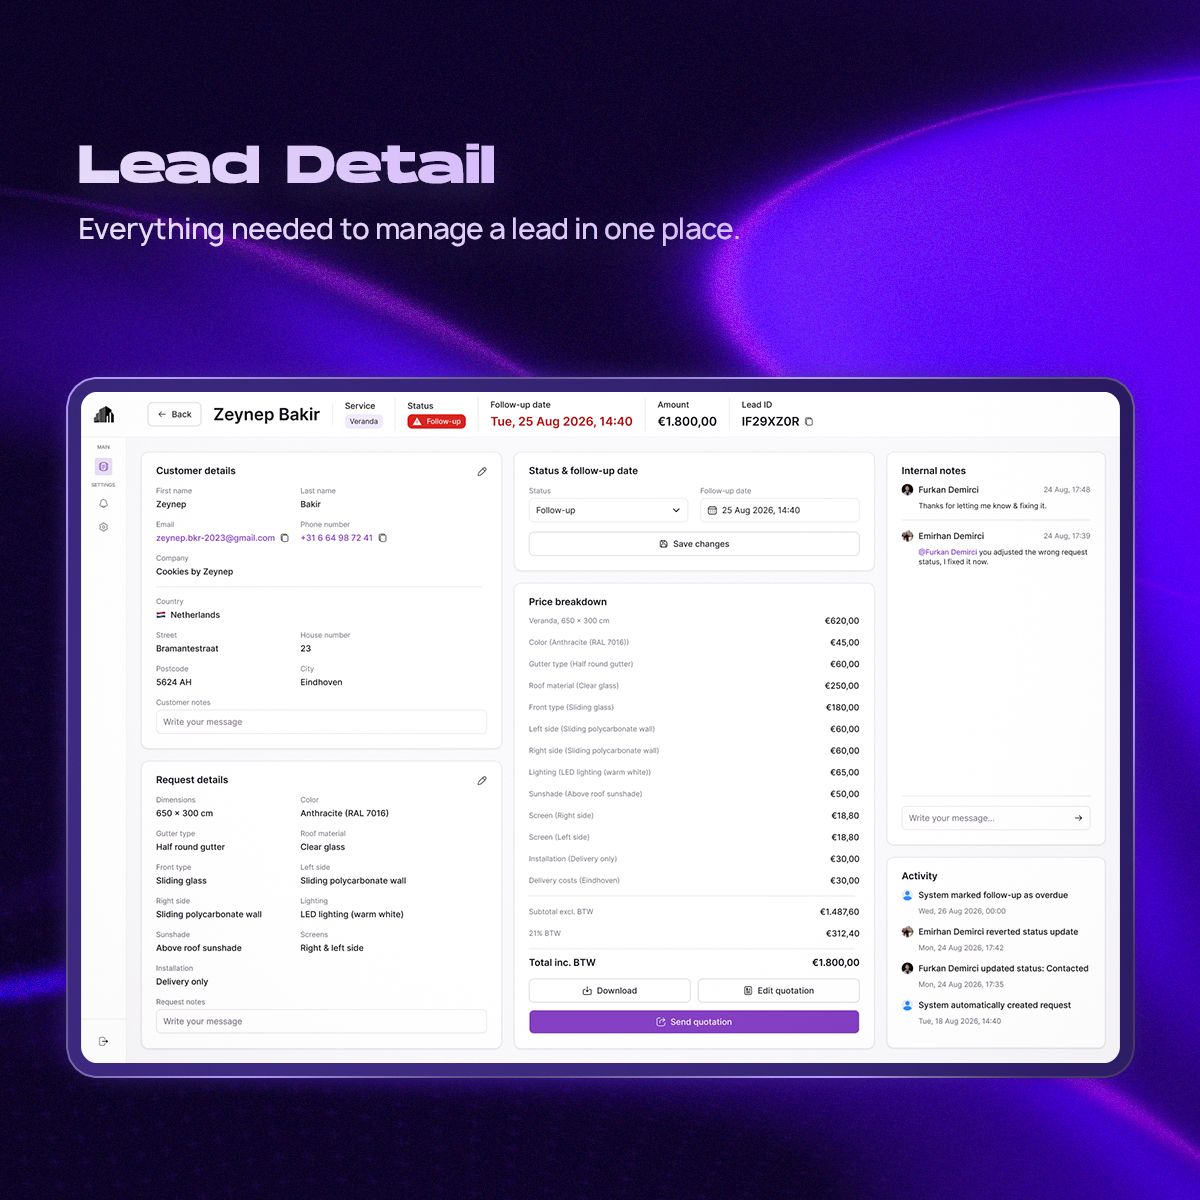
Everything about a lead in one place
Customer details, request details, notes, status and pricing sit together, so nobody has to search through conversations or documents to understand what happened with a lead.
Actions that change the state of a lead, like updating its status or follow-up date, stay within easy reach.
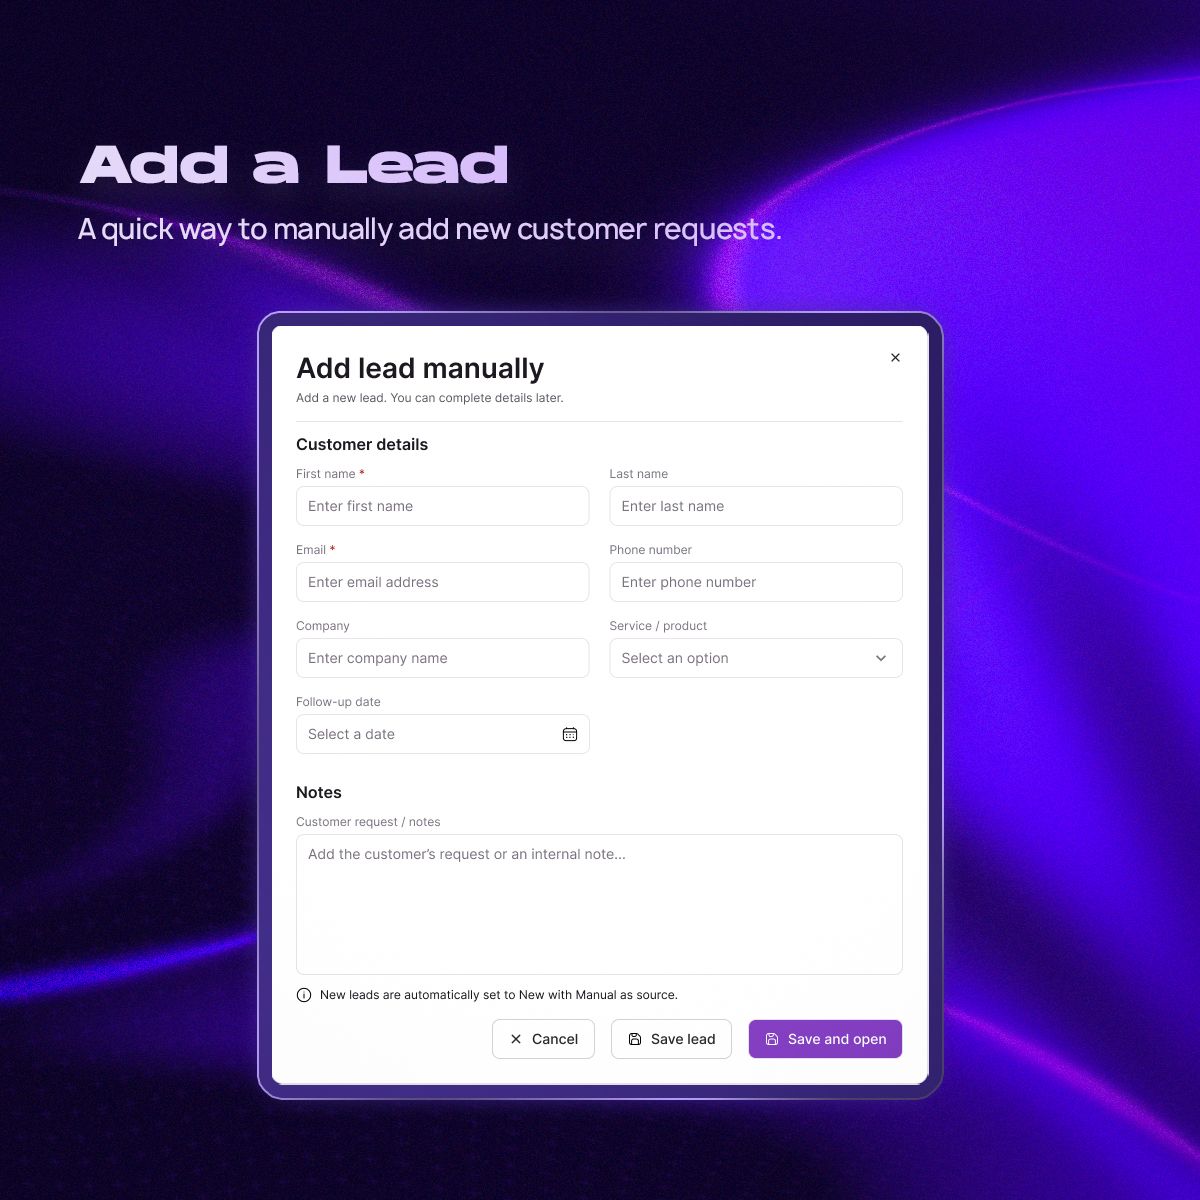
Adding a lead by hand
Requests that come in by phone, WhatsApp or referral can be added manually. I kept this deliberately light: enough information to create a usable lead, without turning a quick admin task into a long form.
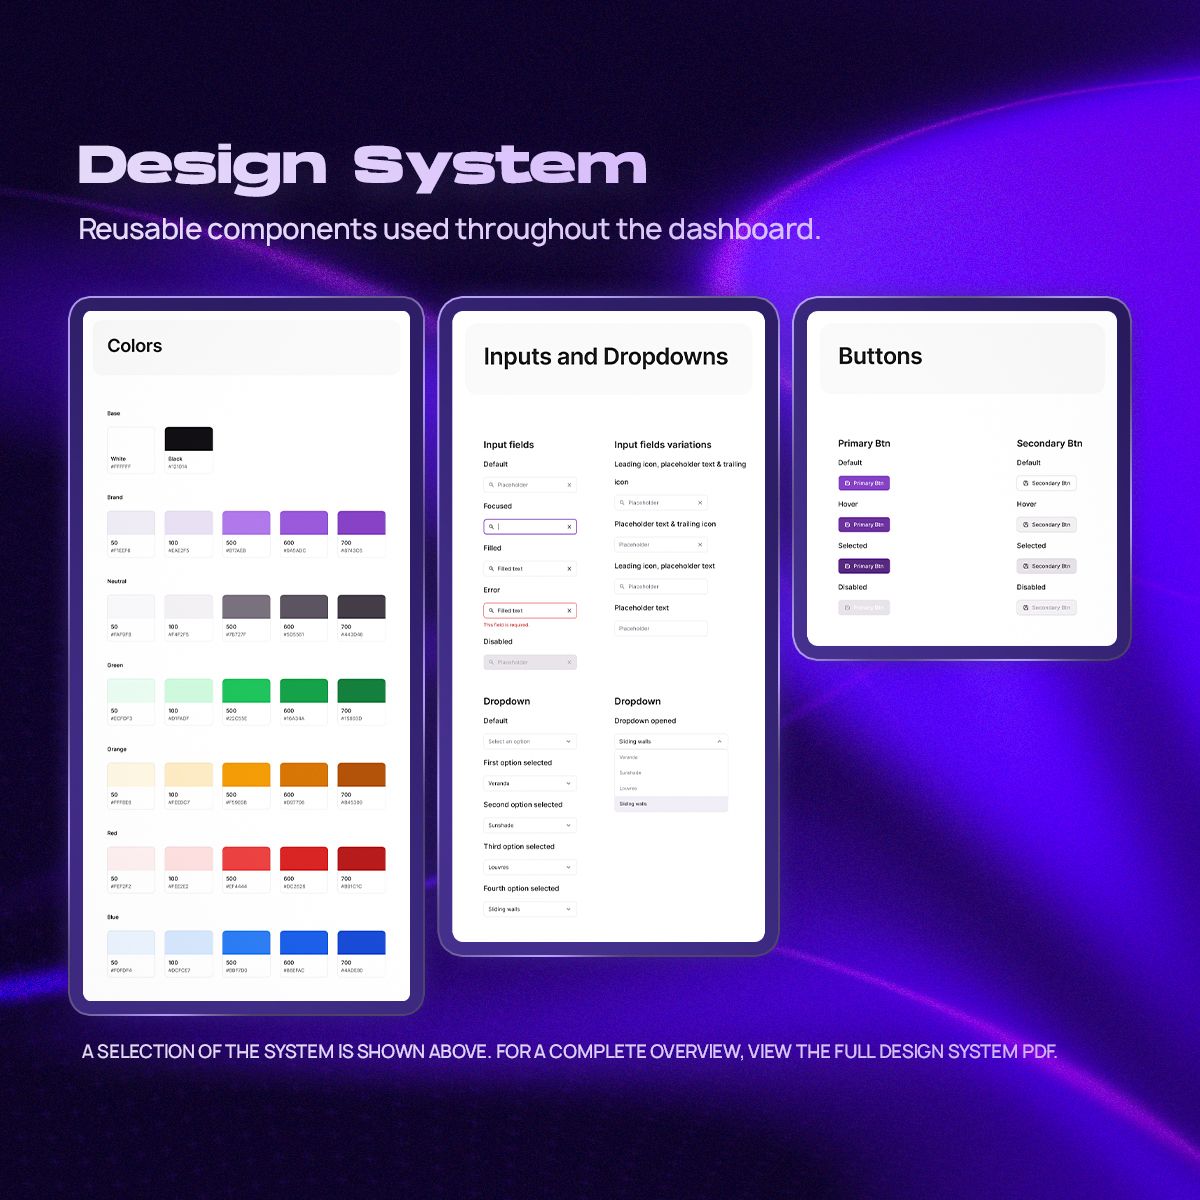
A reusable UI system
Alongside the screens, I created reusable components for buttons, status indicators, form fields, cards, navigation and tables. They keep interactions and hierarchy consistent, and make it easier to add new screens later.
Outcome and reflection
I delivered a design concept that brings leads, quotations and follow-ups into one structured overview, as an alternative to WhatsApp threads, notes, spreadsheets and memory. The structure wasn’t based on assumptions: it evolved through interviews, think-aloud testing of the prototype and several design iterations during the internship.
- 01
Knowing when not to add
It was easy to imagine a dashboard full of CRM features, analytics and automation. The research kept pointing back to simplicity, overview and speed.
- 02
Noticeable, not just visible
Testing showed the difference between information that is technically on screen and information people actually notice.
- 03
What I’d explore next
Once there is real usage data: team ownership of leads, conversion insights and an analysis of lost leads.